Metric Properties of Map Projections
(as used on this site)
www.axismaps.com/guide/map-projections
If I had know about this article earlier, I might have just adopted it…
Aside from the different groups, you can classify map projections by their by their preservation of a metric property.
In my opinion, the knowledge of the different propierties is more important for the »everday use« of world maps.
On this website, I’m using four categories of property, which now will be explained briefly.
Conformal Projections
Quoting Carlos A. Furuti of progonos.com:
A conformal (or orthomorphic) map locally preserves angles. Thus, any two lines in the map follow the same angle as the corresponding original lines on the Earth; in particular, projected graticule lines always cross at right angles.
So while conformal maps are vital in marine navigation (because you can follow the course of a stright line drawn on the map),
they have disadvantages for other purposes. For example, they severely distort areal relationships.
Maybe you think that the Mercator projection shown below looks right.
Of course, unless you are interested in world maps or watched a certain episode of the TV show The West Wing. ;-)
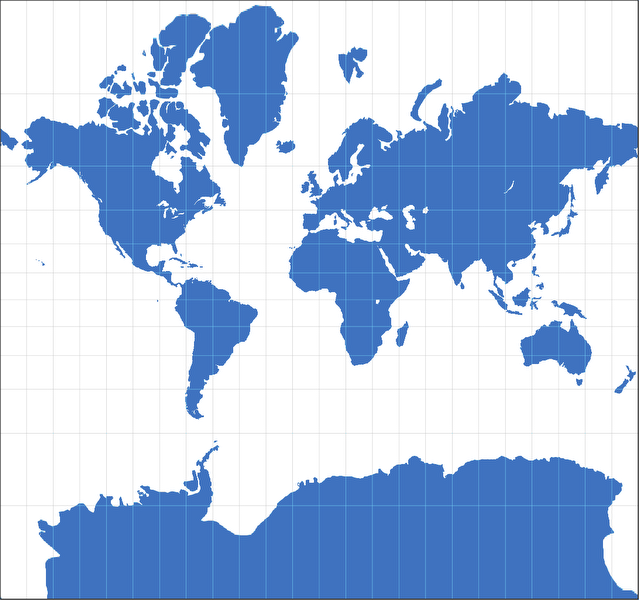
The Mercator projection with its severe distortions of sizes
Anyway, since the Mercator projection is widespread, many people do assume that it depicts areal relationships accurately. But in fact, Greenland seems to be about the size of Africa – while in reality, Africa is about fourteen times larger than Greenland: 30,221,532 km² (11,668,599 sq mi) vs. 2,166,086 km² (836,109 sq mi).
To illustrate this, let’s have a look at the Stereographic projection, which is conformal, too:
I guess that nobody would assume that it depicts the Earth accurately. Yet the distortion of areal relationships is
quite similar to those we meet in the Mercator projection. It is indeed just as right (or wrong) as Mercator is.

Stereographic Projection, polar aspect
It is often said that conformal projections don't distort the shapes. And this is right, but only locally. On a world map, at some point the distortion of size will kick in and lead to distortion of shapes, too. For example, look at South America in the Stereographic Projection: Suppose you’d cut up the continent into a lot of little square-shaped pieces. Each of those squares would show its part of South America with correct shapes. But since the south tip is much more enlarged than the northern spheres, the shape of the continent in total is distorted in shape!
Equal-Area Projections
Explaining equal-area (also called equivalent or authalic) projections is simple:
They show the Earth with correct areal relationships.
As said before, in the real world Africa is about fourteen times larger than Greenland. So on an equal-area map,
Africa is about fourteen times larger than Greenland, too. Easy to understand, is it? :-)
Unfortunately, equivalence comes at a price:
The shapes are distorted, almost everywhere on the map. Typically, there’s a small (a very small) section on the
map where the shapes are accurate, but the farther you move away from this section, the more severe distortions get.
’nuff said. So let’s just look at two examples of equal-area projections and then move on to the next category.


Equal-area projections: Mollweide (left) and Wagner VII
Compromise (Aphylactic) Projections
Let’s recapitulate:
Conformal projection preserve the shapes quite well, but distort areal relationships.
Equivalent projections preserve areal relationships, but substantially distort shapes.
So what could be more reasonable than designing a compromise?
Projections, that will distort both shapes and areal relationships, but to a lesser degree.
And that’s (as you probably have guessed by now) is what the compromise projections are all about.
Note from 28 Aug 2015:
I just found out that compromise projection are sometime called aphylactic.
I really like this term so I intend to use occasionally in the time to come… :-)
They are trying to strike a balance between distortions, and thus, they are »accurate« (in the sense of keeping metric properties) at no point of the map, but maybe (if well done) even giving you a better idea of how the Earth is layed out than both of the aforementioned kinds.
A very good example for such a compromise is the Robinson projections, since its creator, Arthur H. Robinson, had the defined goal to create a map that is pleasant to the eye, good-looking rather than being accurate in a mathemetical sense.
And so, he didn’t even start with a mathematical approach: To put it simply, he tinkered around with shapes and sizes until he felt
that the result looked good, and then worked out the mathematics for it.
Thus, the Robinson projection can’t be described by a formula – instead, it is based on a table of latitudes and their scaling factors.
And in my opinion, he succeeded very well in creating a beautiful map.

Robinson’s compromise projection
The Robinson projection was the reference world map of the US National Geographic Society (NGS) from 1988 to 1998, and was replaced by the Winkel Tripel – another compromise projection. If you happen to go to a german school in the 1970s (just like me) or later, you’ve probably seen the Winkel Tripel in the Diercke Atlas (a very popular school atlas).

Winkel Tripel
Equidistant Projections
I’ve put the equidistant projection to the end of this article, because it’ll take a few words more to explain them – and because in my personal opinion, it’s the least interesting property of the four discussed here.
But I’m starting with a short explanation:
Equidistant projections preserve distance from some standard point or line.
Got that?
No?
Me neither.
You did?
Hey, so you’re brighter than me and can skip the rest of this article…
So, here’s the long explanation:
Did you ever try to determine the distance between two points in the Earth – say, between Rome and New York City, as the crow flies –
by holding a ruler against a printed map and then multiplicating the measurement you got in centimeters or inches by the nominated
scale of the map?
Well, you didn’t get the correct result.
For example:
I’ve got a world map (Wagner VIII projection) on a scale of 1 : 75,000,000.
Using a ruler, I am measuring a distance of 10.6 cm (4.17 in), which results in a distance of
roughly 7,950 km (4,940 mi). Yet every source on the web will tell me that the distance between Rome and New York City
is 6,889 km (4,281 mi). So what’s wrong? Did I measure inaccurately? Did I miscalculate? Did the map makers screw up?
No, none of this.
The thing is: It doesn’t work this way.
As I have pointed out elsewhere, every world map has some kind of distortion, and that’s what leads to incorrect results.
Since Wagner VIII is a compromise projection, did I choose the wrong type of map for the measurement? Should I have tried using an equidistant map? – No, in most cases that would have failed, too.
And that is because the term equidistant might give you the wrong idea: You might think that
all distances are displayed true to scale – but in fact, only some distances are shown true to scale.
On the Plate carrée projection, that applies to distances along the meridians. So you can use this map e.g. to measure
the distance between Hamburg and Douala (the largest city in Cameroon) – both are located at about 10° East.
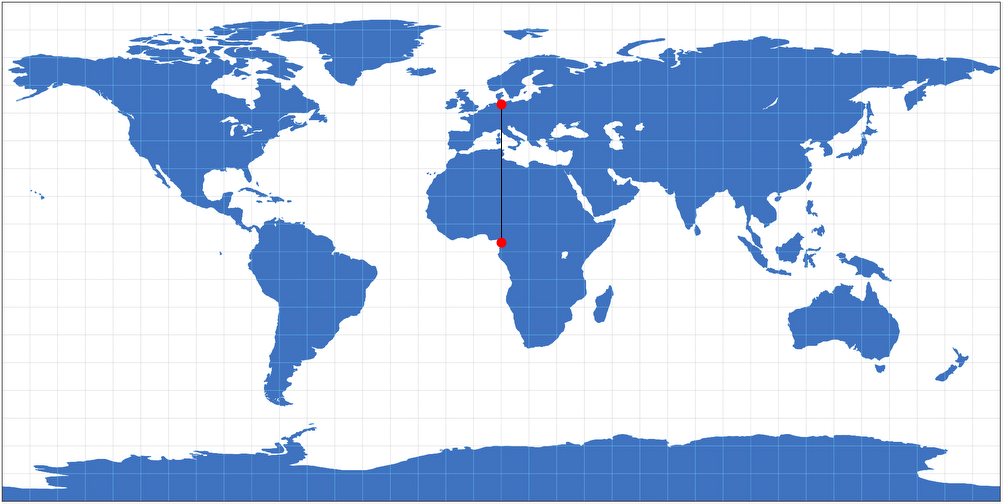
Plate carrée projection with a line between Hamburg and Douala
But for most distances, you’re going to need a special map. Coming back to the Rome/New York example, the Azimuthal equidistant projection will be appropiate. On this map all points on the map are at proportionately correct distances from the center point. So let’s have a look at a map which puts NYC to the center:
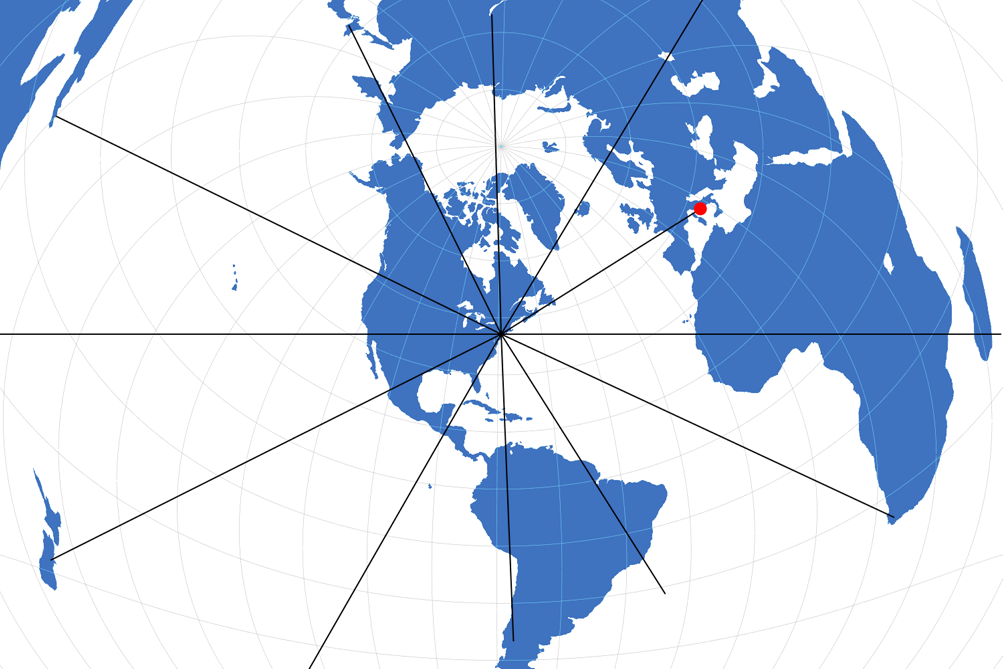
Azimuthal equidistant projection, centered to New York.
Along the black lines (and all others which lead to the center but aren’t drawn on the map) distances can be measured correctly. And what happens when you want to measure the distances between Rome and Rio de Janeiro? – You need a different map.
A final example: The two-point equidistant projection.
It is, in a manner of speaking, an extended version of the azimuthal equidistant projection: Instead of one, you’ve got
two anchor points which are arbitrarily chosen by the mapmaker. Distances from the two points to any other point
(and thus, or course, the distance from the first to the second point) on the map are correct.
In the image below, the two anchor points were set to 45° North, 40° East und 30° North, 110° East:


And again: For all other points you can’t measure distances correctly, so you’d have to render a new map using a different configuration. At least, the configuration shown above results in a map of Eurasia which is relatively free of distortion – which is nice, too.
Finally, I’d like to point out that a projection can be both equal-area and equidistant, e.g.
the Sinusoidal projection is equidistant along the parallels;
Stab-Werner is equidistant along the parallels, the central meridian and on all distances from the north pole – but both
are equal-area, too.
The question if a compromise projection can be equidistant as well depends on the definition of the term compromise:
If you define it as the absence of any other designated property – then, of course, a compromise projection can’t be
equidistant at the same time. On the other hand, if you define the term as a projection which strikes a balance
between equivalence and conformality – then yes, a compromise projection can be equidistant as well.
I prefer the latter definition.
That’s why e.g. Wagner VI is listed as compromise projection, although it’s equidistant along the equator and the
central meridian. Only when I felt that it’s a projection’s most important property to show certain distances
true to scale, I’ve put it to the group of equidistant projections.
Back to Basic Knowledge • Go to top
Comments
Due to spam posts, comments are now subject to moderation, which means they remain hidden until they are approved by a moderator.
One comment
There are further comments in the german version.
Tobias Jung
And of course, no map has correct distances between arbitrary points. But if the area of interest is small enough, you can get results that do not deviate too far from the real distance.
Alexandre Canana
Alexandre Canana